Safe spending in retirement, new data by Challenger Annuities
Tobias Fellas
July 31, 2024
New data from Challenger Annuities showcases safe spending levels in retirement on a given super balance.
As a quick summary, Challenger Technical team have released an updated guide on how much someone can afford in retirement. The data has been updated as of March 2024 and was provided to me by the head of technical services at Challenger, Andrew Lowe.
For the full and deep-dive, please see their PDF document explainer here.
In the 60 second video below, Andrew quickly summarised the importance of this safe spending data and how it can give confidence to clients.
Why I like this data
This is simple and straightforward data that you can present to a client and give them a good understanding of how much they can retire with in the first meeting on a given super balance.
This is giving safe and trusted information to clients while leading them towards better understanding of what their goals are in retirement. Simply, I see this as a fantastic conversation starter with a prospect who can take home genuine useable information and come to you to help them set up strategies.
Calculating a safe level of spending
To calculate a safe level of spending Challenger uses over 2000 scenarios of market returns data and complex stochastic modelling to arrive at a 90% confidence level i.e 9 out of 10 scenarios, a retiree can safe spend a certain amount of money per annum indexed to inflation each year until their life expectancy.
Baseline assumptions
Their 90% confidence safe spending level is based on a 50/50 risk profile (i.e 50% growth/defensive split) in an account based pension until life expectancy.
They also use an improved version of Australia life tables of 2015-2017 including 25 year mortality rates.
Data Set 1 - Couple, Aged 67, homeowners
The data below shows safe spending in retirement at age 67 of both male and female couple between super balances of $200k to $3.8m. Column 2 shows that a 90% confidence, what they can draw until life expectancy, column 3 shows that life expectancy plus 3 years, what confidence level they can draw that amount, column 4, same as previous but a life expectancy plus 6 years.
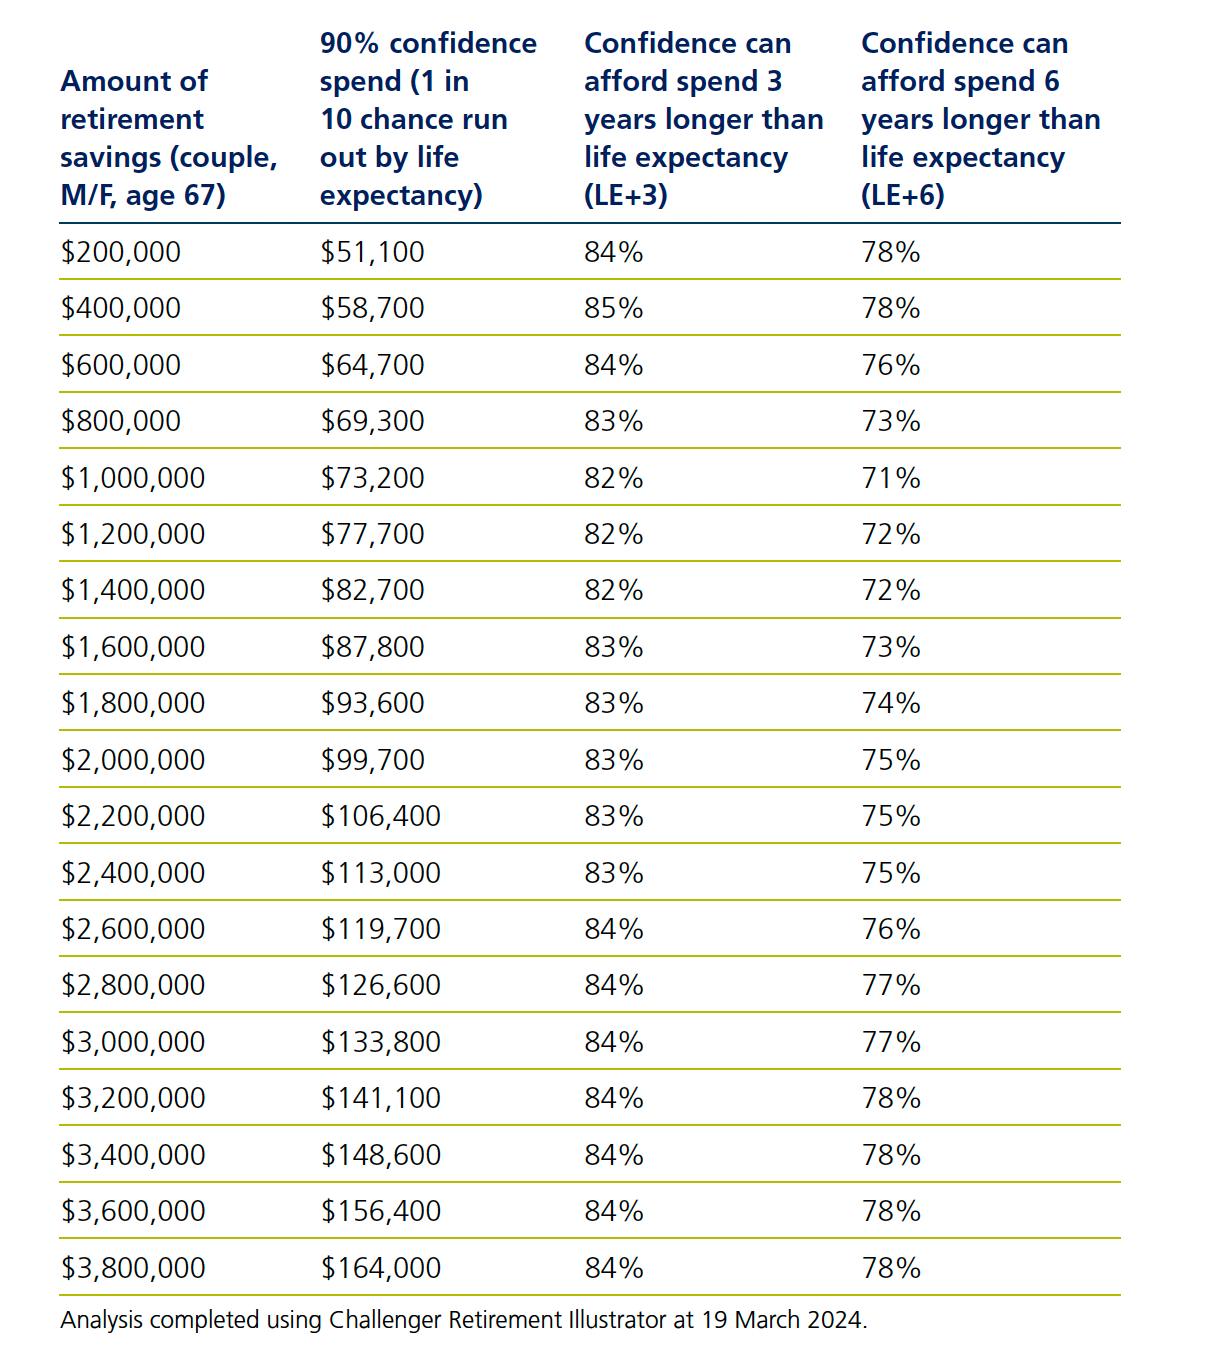
What this data is saying is that at $1m of total retirement savings at age 67 of the couple, they can be 90% confident they can spend $73,200 per annum CPI indexed until their estimated life expectancy which would be somewhere around 87 years old (male) and 92 years old (female).
What the other columns are saying is that there is a 82% confidence level that they can draw the same amount to 3 years beyond life expectancy and 71% confidence if 6 years above estimated life expectancy.
Data Set 2 - $1m in super, ages 62 -77, what is safe spend amount?
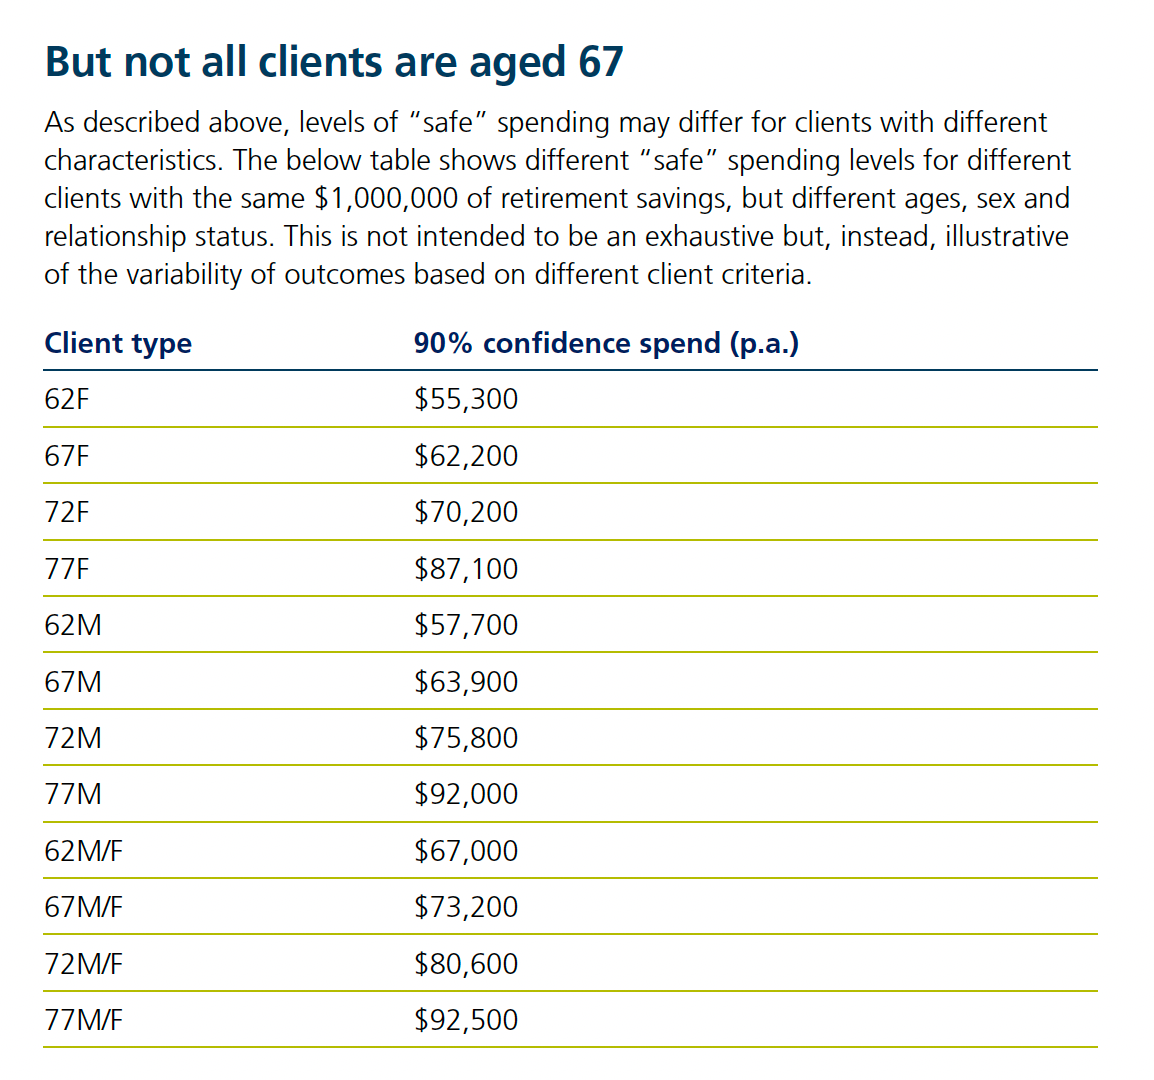
In this data set, it showcases at $1m retirement savings how confidently someone can draw down till life expectancy on a given age, sex and relationship status.
A big thank you to Challenger tech team and Andrew Lowe, head of Tech for providing me with this data, their presentation slide deck and quick 60 second video.


Send us a message
Contact Us
We will get back to you as soon as possible
Please try again later
We're humans too.
Give us a call or email us directly

Tobias Fellas (director)
Mob: 0401 050 537
Email: tobias.fellas@felcorp.com
L36, 1 Macquarie Pl
Sydney NSW 2000 (by appointment only)
More about Felcorp Support
What offshore staff we provide
0401 050 537
tobias.fellas@felcorp.com
© Felcorp Support | All rights reserved
Felcorp Support is an independent outsourcing staff supplier. All staff are employees of Felcorp Support and are not affiliated or in partnership with any other business outside the Felcorp Group. We do not have any professional services licences or registrations and never purport to have any of these professional registrations.